
Everyone’s watching the Middle East.
Oil prices… Meetings with Iran… And the Strait of Hormuz.
But that’s not the real story.
The real story is something much bigger. It’s happening quietly… methodically…
And it’s far more dangerous to US hegemony.
China is dismantling the foundation of U.S. financial power.
Not with weapons.
With gold.
For nearly two decades, they’ve been building something intelligence analysts now call the “Gold Corridor.”
The “Gold Corridor” isn’t just a bunch of warehouses holding China's growing stockpile…
It’s a parallel financial system – backed by gold… and operating totally outside the US dollar.
You’ve never heard about it because there were no headlines – and no press conferences.
Just steady execution.
Now, here’s the part no one is telling you…
Washington knows this is happening – and their only real counter-move requires one thing:
Much higher gold prices.
That’s why this moment matters.
Because for the first time in history, the world’s two superpowers both need gold to rise…
The outcome isn’t speculation…
It’s math.
And it creates a very specific opportunity – but not in gold itself.
A tiny group of gold companies have produced gains of 100%… 500%… even 2,000%+ – and that’s just in the last two years!
The best part is…
The biggest move hasn’t happened yet.
But you’d better not wait.
Go here for details on America’s “Gold War” with China and find out what’s coming
Best,
Garrett Goggin, CFA, CMT
Chief Analyst and Founder, Golden Portfolio
JPMorgan Stock Is Coiling Near All-Time Highs — Here's What Comes Next
Submitted by Thomas Hughes. Article Posted: 4/14/2026.
Key Points
- JPMorgan's stock price chart shows bullish activity across multiple time frames and is on track to sustain its long-term uptrend.
- Capital returns, including dividends and buybacks, underpin the outlook.
- Institutional activity provides solid support in 2026 and limits the downside risk.
- Special Report: The Biggest IPO Ever: Claim Your Stake Today
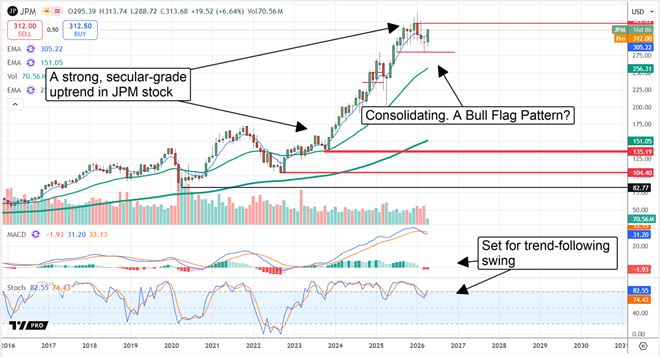
JPMorgan’s (NYSE: JPM) stock looks range-bound on the daily chart, but a broader view tells a different story. On the monthly chart, JPMorgan is in a secular uptrend and is consolidating near all-time highs in 2026. The upswing began after the COVID‑19 pandemic—fueled by global stimulus—and was later accelerated by acquisitions, client growth, and market-share gains, all of which support the current outlook.
Available Now: Investigating Project Prophet (Ad)
Porter Stansberry flew the Porter and Co. team 3,300 miles to Dublin to investigate a 17-year investing experiment called Project Prophet - and documented everything on film.
Rooted in the laws of physics, this quantitative approach challenges conventional wealth-building wisdom. With 17 years of verified data behind it, Porter calls it unlike anything he has seen in nearly 30 years in the business.
Watch the full investigation and decide for yourselfIf JPM is forming a bull flag on the monthly chart, investors should expect continued consolidation in the near- to mid-term followed by a bullish breakout. The initial move could be roughly the magnitude of the flag pattern—about $40, or 14.25% from the range top—but the longer-term move could be substantially larger. As a base-case projection it could reach approximately $180 (the pole's magnitude), and in a full bull scenario the upside could approach 128%.
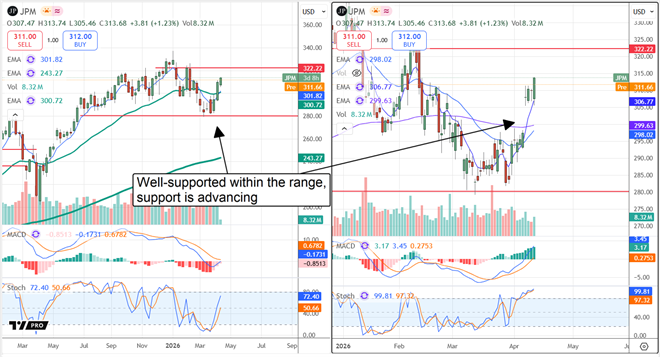
The weekly and daily charts also point to consolidation with the potential for a bullish upswing later this year. JPM stock appears to have bottomed in late Q1 and began rebounding in early Q2. The fiscal Q1 earnings release prompted a small premarket pullback, but that did not change the broader outlook—rather, it provided a chance to buy within the “buy zone.”
Who’s Buying JPM Stock? Analysts and Institutions
Analyst and institutional data suggest both groups are likely buyers of JPM stock. Analysts trimmed price targets in Q1, which contributed to the recent downdraft, but given the Q1 results and the company's capital-return outlook, further cuts seem unlikely in Q2.
Among the 29 analysts covering JPM, the consensus rating is Hold, with a roughly 48.3% buy-side bias and no sell ratings. As of mid-April, the consensus price target implies about 5% upside, and that target is likely to rise if performance continues to improve.
Institutional ownership provides additional support: institutions hold more than 70% of the shares and have been net buyers at roughly a 2-to-1 pace over the trailing 12 months, a trend that persisted through Q1 2026. With heavy institutional accumulation, JPM is unlikely to break down from its trading range absent a material change in fundamentals.
Fundamentally, the company continues to grow, generates substantial cash flow, and returns capital to shareholders.
JPMorgan’s Capital Returns Are Safe, Reliable, and Growing
JPMorgan’s capital returns are supported by a strong balance sheet and ample capital reserves. While the bank faces the same macro risks as its peers, it remains well-capitalized and positioned to withstand significant shocks. The dividend yields about 1.9% with shares near the middle of their trading range, and the payout represents less than 30% of projected earnings for the year. With 15 consecutive years of dividend growth, JPM is on track for potential inclusion in the Dividend Aristocrats index over time. The distribution's compound annual growth rate (CAGR) of roughly 10% comfortably outpaces inflation and supports income-compounding strategies.
Share buybacks provide even more capital return, totaling nearly twice the dividend amount. The company repurchased $8.1 billion of stock net, reducing shares by about 1% sequentially and 4% year over year. The buyback pace is likely to continue through 2026 and could accelerate later in the year given the results and outlook.
JPMorgan beat consensus on both the top and bottom lines for Q1 results. Segment performance was mixed versus forecasts, but strengths offset weaknesses and every segment contributed to overall growth. The standout was the Commercial and Investment Bank (CIB), where fees rose 28% and Markets revenue jumped 20% on stronger client activity.
Guidance was constructive. Management issued a slightly weaker-than-expected outlook for net interest income (NII), but that miss was balanced by other positives, including commentary that the U.S. economy remains resilient, with healthy consumers and businesses and emerging tailwinds. Management pointed to government spending, deregulation, and investment in AI as supportive factors. The primary risk to JPM stock this year is the broader macroeconomic uncertainty and the potential for escalating geopolitical tensions or economic disruption.
3 ETFs to Benefit From Oil Price Surge Without Direct Investment
Submitted by Nathan Reiff. Article Posted: 4/18/2026.

Key Points
- The price of oil is back down compared to earlier in the Iran war, but volatility still remains a dominating factor.
- Investors keen to reap the benefits of this turbulence but not interested in investing directly in oil futures might turn to oil infrastructure and services ETFs.
- Funds like PXJ, IEZ, and XES track shares of companies involved in the oil industry without being directly linked to oil itself or to producers.
- Special Report: The Biggest IPO Ever: Claim Your Stake Today
Though near-term pressures from the Iran war appear to be easing, 2026 has been a lesson in how quickly and dramatically the cost of oil can fluctuate. Crude oil futures that started the year around $60 spiked to more than $112 in early April before pulling back to roughly $90 as of mid-month. That volatility will push some skittish investors toward safer plays, but it also creates opportunities for those willing to accept more risk.
Investing in oil can be complicated, especially for those without prior experience. One way to limit exposure and avoid direct commodity ownership is through exchange-traded funds (ETFs), which can be structured to benefit from rising oil prices while simplifying many of the operational details for individual investors. A further step away from the commodity itself is investing in funds that target oil-adjacent stocks—companies that provide equipment, infrastructure and services to the industry.
A 20-Year-Old Fund With Outsized Returns and Dividends
Available Now: Investigating Project Prophet (Ad)
Porter Stansberry flew the Porter and Co. team 3,300 miles to Dublin to investigate a 17-year investing experiment called Project Prophet - and documented everything on film.
Rooted in the laws of physics, this quantitative approach challenges conventional wealth-building wisdom. With 17 years of verified data behind it, Porter calls it unlike anything he has seen in nearly 30 years in the business.
Watch the full investigation and decide for yourselfThe Invesco Dynamic Oil & Gas Services ETF (NYSEARCA: PXJ) focuses on U.S. oil services companies and holds roughly 30 names in this niche. One of its largest holdings—Halliburton Co. (NYSE: HAL)—represents about 5.4% of the portfolio and is likely the most familiar company to general investors. The other firms in the basket provide essential services that allow domestic oil producers to operate and handle transport and storage across the country.
PXJ is an early entrant to the ETF space, with more than 20 years of trading history. Its targeted focus means it has a relatively small asset base of $121 million and a modest one-month average trading volume of roughly 93,000 shares.
PXJ’s year-to-date (YTD) return of about 40% and one-year return north of 80% show how closely these companies track the price of oil. A dividend yield of 2.2% provides an added income boost, but its net expense ratio of 0.63% makes it one of the more costly options in this group.
A Lower-Fee Alternative, But Be Mindful of Weighting
A lower-cost alternative is the iShares U.S. Oil Equipment & Services ETF (NYSEARCA: IEZ), which covers a similar universe but charges just 0.38% in fees. Like PXJ, IEZ targets domestic oil equipment and services companies and holds a portfolio of a little more than 30 stocks.
A key distinction is portfolio concentration. PXJ spreads its assets more broadly, while the two largest positions in IEZ—SLB Ltd. (NYSE: SLB) and Baker Hughes Co. (NASDAQ: BKR)—together account for about 45% of the fund. That concentration can raise single-name risk, but it has also supported strong performance: IEZ has returned more than 35% YTD and roughly 70% over the past 12 months. The fund offers a dividend yield of about 1.2%, lower than PXJ’s but still meaningful.
Even Lower Fees, Strong Returns, But a Smaller Dividend
The SPDR S&P Oil & Gas Equipment & Services ETF (NYSEARCA: XES) charges the lowest fee of the three at 0.35% annually. XES follows an equal-weight approach across its nearly three dozen holdings, so no single position exceeds about 4.5% of the fund—an approach more similar to PXJ than IEZ.
XES also benefits from greater scale and liquidity: it manages close to half a billion dollars in assets and posts substantially higher one-month trading volume than PXJ. That scale has coincided with strong returns—almost 40% YTD and about 90% over the last 12 months.
Dividend yield is another differentiator. XES’s yield is roughly 1.2%, which is lower than PXJ’s 2.2%. Investors prioritizing passive income might prefer PXJ despite its higher fee and smaller size, while those seeking lower costs and better liquidity may favor XES. Regardless of the choice, all three funds have notably outperformed the broader market on both a YTD and one-year basis.
This email content is a sponsored message for Golden Portfolio, a third-party advertiser of InsiderTrades.com and MarketBeat.
If you have questions or concerns about your account, feel free to email MarketBeat's U.S. based support team at contact@marketbeat.com.
If you no longer wish to receive email from InsiderTrades.com, you can unsubscribe.
Copyright 2006-2026 MarketBeat Media, LLC. All rights reserved.
345 North Reid Place #620, Sioux Falls, South Dakota 57103-7078. United States of America..