
Hi, Tim Plaehn here.
Bank of America predicts silver prices could hit $309 in 2026.
But while everyone's chasing silver bullions…
A handful of investors are doing something different.
They're getting paid every single month from a new investment tied directly to silver's historic surge.
I'm not talking about mining stocks, options, or physical bullion.
I'm talking about a powerful little-known income fund — trading for just $42 — that's delivered up to 20% in annual distributions….
And could give you the chance to collect $1,170/month.
Click here to get monthly payouts from silver.
But hurry: the next payment is just days away.
To your income,
Tim Plaehn
Lead Income Strategist, Investors Alley
Lululemon's Share Price Bottom Is In: Nowhere to Go But Up
Reported by Thomas Hughes. Date Posted: 3/20/2026.

Key Points
- Lululemon is set up to rebound in 2026 as it builds momentum in international sales, drives cash flow, and buys back shares.
- Analysts weigh on price action in early 2026, as weak guidance undermines confidence, but outperformance is likely.
- Institutions are accumulating LULU at long-term lows, providing a floor for the action and limiting downside risk.
- Special Report: Elon Musk already made me a "wealthy man"
Lululemon's (NASDAQ: LULU) share price may face hurdles in 2026, but signals from technical charts, valuation metrics, analysts, institutional activity, and recent earnings suggest further declines are unlikely. There is always risk with this retail stock, but at current levels Lululemon's potential appears to outweigh those risks, offering an attractive reward profile for investors willing to buy in.
The technical charts are a good place to start. They indicate a potential bottom and the earliest signs of a rebound across multiple timeframes.
The Biggest IPO Ever: Claim Your Stake Today (Ad)
What if you could shrink your entire wealth journey from decades down to just 24 hours?
Sounds impossible…
But I'll show you how Elon Musk is about to make it a reality.
This could be the best investment opportunity of the decade.The monthly chart is the weakest, but it still aligns with a bottom near $164 — roughly the late‑2019 highs.
That level also corresponds with the early‑2020 lows driven by COVID‑19 fears and is likely to act as a strong floor given the price action then and the opportunity today.
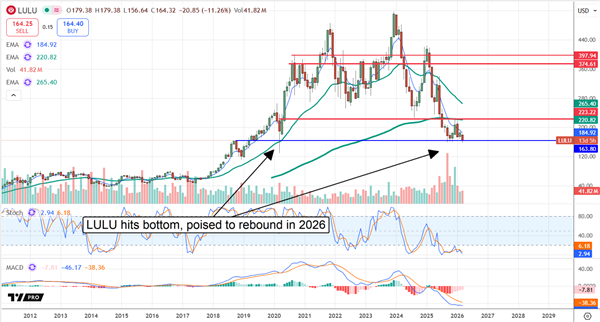
Weekly and daily charts are more constructive, suggesting not only a price floor but also the earliest signs of an advance. In this scenario, Lululemon's stock is set to gain momentum through 2026 as investment dollars rotate back into the name.
Valuation metrics point to a deep value opportunity. The stock sits near early‑2020 levels while revenue is more than 185% higher. The market premium in 2019 is no longer justified, yet the outlook remains robust. Trading at roughly 12X earnings, the shares appear undervalued — offering potential for near‑term multiple expansion and much larger long‑term appreciation. Current valuation implies nearly 100% upside relative to the S&P 500 average, while longer‑term forecasts suggest 500% or more upside by 2035 or sooner.
Analysts and Institutions Signal Floor for Lululemon
Analyst sentiment has pressured price action in 2026. Price targets were trimmed after the fiscal 2025 release, but the revisions largely align with a market bottom. The low end of revised targets sits below current levels, though the most pessimistic targets appear to be outliers.
The consensus of six targets issued within the first 18 hours of the release was $180 — below the broader consensus but well above the critical support level — while the high‑end target points to $225.
At present, analyst sentiment provides no immediate catalyst for a rebound, though that could change later in the year as subsequent reports and guidance arrive.
The company's 2026 guidance appears to have been conservative, and upcoming releases could outperform expectations or come with improved guidance, which would likely shift analysts' and market sentiment higher.
Institutional activity also aligns with the idea of a price floor, suggesting the downside is limited.
Institutions own more than 85% of the stock. After distributing shares in the back half of 2025, they returned to accumulation in Q1 2026. Early Q1 activity showed more than $2 bought for each $1 sold — a strong cadence that provides solid support.
Lululemon Ended 2025 on a High Note: Guides Downbeat for 2026
Lululemon reported a solid quarter to close 2025, generating $3.64 billion in net revenue — a 0.8% year‑over‑year increase that beat consensus by 170 basis points. Strength came from International segment sales, offset by mild declines in the Americas and a tough comp that included an extra week in the prior year. Adjusting for that extra week, growth was about 6%, with comps up 3% systemwide and 15 net new stores added.
Margins were another area of relative strength. While the company saw margin pressure as expected, it was less severe than feared. The net result was a contraction in earnings, but the impact was smaller than forecast; GAAP EPS came in at $5.01, nearly a quarter better than expected. More importantly, cash flow, the balance sheet, and capacity for share buybacks are in better‑than‑expected shape, supporting the case for a share price rebound.
Share buybacks are significant. They reduced the share count by 3.85% in fiscal 2025 and are expected to continue aggressively in 2026. The balance sheet shows no red flags, indicating sufficient capitalization and manageable leverage to continue executing strategy and building shareholder value.
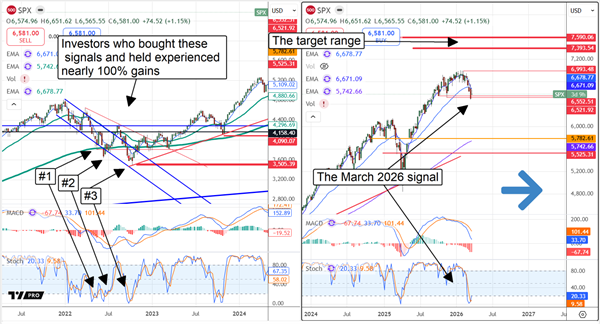
S&P 500 Fires Buy Signal With 100% Accuracy Rate: What Comes Next
Written by Thomas Hughes. Article Posted: 3/25/2026.

Key Points
- The S&P 500 entered oversold territory in March, triggering a buy signal with 100% accuracy.
- The index faces headwinds, but fundamentals and earnings outlook offset it.
- Oil and inflation are risks that may keep the market trending sideways in the near-term.
- Special Report: Elon Musk already made me a "wealthy man"
The S&P 500 entered oversold territory on its weekly candlestick charts late in March, triggering a buying signal with a 100% accuracy rate over the trailing 15-year period. "Oversold," as indicated by the stochastic oscillator, describes a market that has been sold below its intrinsic value — a situation in which most sellers have likely already exited, leaving a bias toward buyers. In that setup, the index has limited downside and is positioned to rebound, a tendency that has already been confirmed.
Technical, Analysts, and Valuation Trends Converge: Upside Potential Offsets Risks
Chart watchers will note there were three similar signals in 2023. The first produced only a tepid rebound, but the next two prompted much stronger rallies and a full market reversal. That 2023 reversal was driven largely by AI-related momentum and has since produced roughly a 50% gain in the index.
The Biggest IPO Ever: Claim Your Stake Today (Ad)
What if you could shrink your entire wealth journey from decades down to just 24 hours?
Sounds impossible…
But I'll show you how Elon Musk is about to make it a reality.
This could be the best investment opportunity of the decade.The takeaway for investors is that the market is signaling in a comparable way today: near-term headwinds may limit immediate gains, but fundamentals and long-term forecasts provide support. The most likely path is consolidation within the current range, followed by a move higher to new highs later this year.
Analyst sentiment supports that view. Barclays is the latest to raise its target for the S&P 500, citing stronger-than-expected earnings and forward forecasts that offset macro headwinds. It boosted its index target to 7,650, a 250-point increase that places the index near the high end of its expected year-end range.
The value is there, even if it is not uniform across every sector. The S&P 500 was trading near 20x earnings as of late March, roughly in line with long-term averages, while some market leaders still appear attractively priced. NVIDIA (NASDAQ: NVDA), the single most influential stock in the index at roughly a 7% weighting, was trading around 20x current-year earnings — suggesting no premium has been priced in for the company leading the AI cycle.
NVIDIA and other blue-chip tech names often trade in the 30x–35x range when fully valued, implying 50%–75% upside from valuation expansion alone. Combine that with forward forecasts that project the stock at roughly 5x its 2035 earnings, and the longer-term upside case for this market leader grows substantially — to the point that some scenarios show outsized returns compared with today's price.
S&P Set Up to Hit 7,500 This Year
Key technical levels for the S&P 500 Index are 6,521.92 (support) and 6,993.48 (resistance). For the S&P 500 ETF (NYSEARCA: SPY), the equivalent price levels are about $64.72 and $69.78.
Support looks meaningful but could be tested; if broken, the next support band is near 6,400 (about $64 on SPY). On the upside, resistance could keep gains capped in the near term, leaving a 471-point range — roughly $4.75 on SPY — before a larger breakout. Extrapolating that range from resistance points to the upside suggests a minimum longer-term target around 7,464 for the index ($74.65 on SPY), with the higher-end scenario reaching about 7,500.
The likely catalyst for a sustained move higher will be centered on the earnings outlook. Current forecasts call for sequential acceleration in earnings growth in Q1 2026, extending into Q2 and Q3, with high‑teens percentage growth sustained through year‑end.
Those trends imply that leaders such as NVIDIA will continue to outperform, lifting the broader market — with average companies projected to outperform by roughly 3%–5% relative to current expectations. Earnings season begins in mid‑April when JPMorgan Chase & Company (NYSE: JPM) reports, but the most market-moving results may come later, when NVIDIA and other AI-driven firms release their numbers.
Risks remain. Rising oil prices tied to the war in Iran are hovering near long-term highs, adding cost pressure and feeding inflation throughout the system. At these levels, oil could depress earnings and force weaker guidance, which would weigh on market performance. Elevated oil prices and persistent inflation also reduce the likelihood of Fed rate cuts, creating another headwind the market must overcome.
This email communication is a paid sponsorship for Investors Alley, a third-party advertiser of The Early Bird and MarketBeat.
If you have questions or concerns about your newsletter, don't hesitate to email MarketBeat's U.S. based support team at contact@marketbeat.com.
If you no longer wish to receive email from The Early Bird, you can unsubscribe.
© 2006-2026 MarketBeat Media, LLC. All rights protected.
345 North Reid Place #620, Sioux Falls, S.D. 57103. U.S.A..